STOCK MARKET RETURN -13% WITHOUT A HANDFUL OF STOCKS
Bloomberg Finance just published some research where they note that if it wasn’t for 10 stocks the S&P 500 would have a negative return of roughly -13%. This is reminiscent of 1999 when the Fed was pumping massive amounts of liquidity to help the economy, which unfortunately went to propping up asset prices rather than flowing to Main Street.
It is important that investors are aware of what is going on within ‘the market’, leadership is very narrow and returns are herding into a handful of stocks. These 10 stocks are expensive, as outlined below.
Classic late cycle price action finds investors crowding into fewer and fewer expensive names.
Some argue that at some point we will likely experience something similar to the deflation of equity values, circa 2000 to 2003.
The chart below summarizes Bloomberg’s findings, where they stripped out the 10 mega-cap growth stocks into an index and then put the remaining 490 S&P stocks into a ex mega-cap growth index.

Note that we are currently allocated to stocks in client portfolios since, with the help of Federal Reserve Bank stimulus, the current rally can continue. We will use a stop loss to help us manage the risk.
Famed technical analyst Carter Braxton Worth pointed out on 07/20/2020 that the divergence is reminiscent of the dot-com bubble.

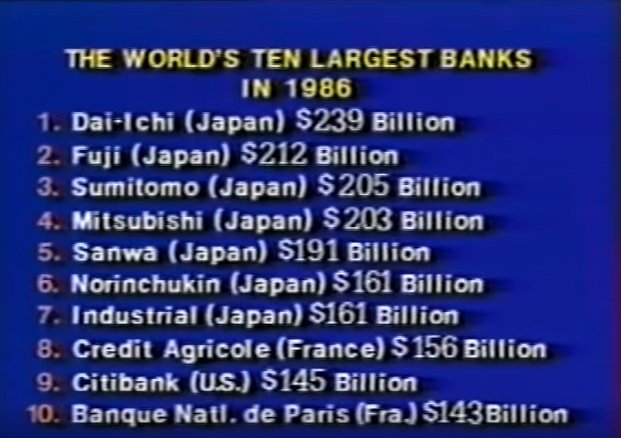
Bubbles regularly form within markets, every decade or so, and in my opinion investors too often fail to manage the associated risk. The ancient graphic that I obtained from the PBS tv show Wall Street Week, below, illustrates this point. In 1986 Japan was the hot market and investors believed that it would be the place to invest for many decades. This did not turn out to be the case.
Earlier this month Bloomberg published the following chart of internet stock P/E ratios (the commonly used valuation ratio). The Nasdaq Internet Index shown here has valuations, that in my opinion are out of sight. We’ve seen this before.

Here are the price to earnings and price to sales ratios for the ten aforementioned companies. Note that the average PE Ratio has historically been 14, over the past 20 years and that a price to sales ratio above 2 is considered rich and above 5 is considered very rich. This is probably why you haven’t seen Warren Buffett buying a lot of companies over the past few years, where instead he has been raising cash.

Markets can advance on the back of narrow leadership for an extended period of time which is only obvious in hindsight. Until the uptrend eventually corrects itself we will help investors manage this risk.
LPL 1-05036420
DEFINITIONS
Bloomberg - Bloomberg provides financial software tools and enterprise applications such as analytics and equity trading platform, data services, and news to financial companies and organizations through the Bloomberg Terminal (via its Bloomberg Professional Service), its core revenue-generating product. Bloomberg L.P. also includes a wire service (Bloomberg News), a global television network (Bloomberg Television), websites, radio stations (Bloomberg Radio), subscription-only newsletters, and two magazines: Bloomberg Businessweek and Bloomberg Markets.
NASDAQ Internet Index: The NASDAQ Internet Index is a modified market capitalization-weighted index designed to track the performance of the largest and most liquid U.S.-listed companies engaged in internet-related businesses and that are listed on the NASDAQ Stock Market, the New York Stock Exchange (NYSE) or NYSE Amex. The Index includes companies engaged in a broad range of internet-related services including, but not limited to internet software, internet access providers, internet search engines, web hosting, website design, and internet retail commerce.
Price-to-Earnings Ratio: The price-to-earnings ratio (P/E ratio) is the ratio for valuing a company that measures its current share price relative to its per-share earnings (EPS). The price-to-earnings ratio is also sometimes known as the price multiple or the earnings multiple.
Price-to-Sales Ratio: The price-to-sales (P/S) ratio is a valuation ratio that compares a company’s stock price to its revenues. It is an indicator of the value placed on each dollar of a company’s sales or revenues. The ratio can be calculated by dividing the company’s market capitalization by its total sales or on a per-share basis by dividing the stock price by sales per share.
S&P 500 Index: The modern design of the S&P 500 stock index was first launched in 1957. Performance back to 1950 incorporates the performance of predecessor index, the S&P 90. The index is a capitalization weighted index of the 500 large companies listed on various stock exchanges (such as the NYSE or NASDAQ). The S&P 500 was developed and continues to be maintained by S&P Dow Jones Indices, a joint venture majority-owned by S&P Global. The S&P 500 differs from the Dow Jones Industrial Average and the NASDAQ Composite index, because of its diverse constituency and weighting methodology. It is one of the most commonly followed equity indices, and many consider it one of the best representations of the U.S. stock market.
IMPORTANT DISCLOSURES
The opinions voiced in this material are for general information only and are not intended to provide specific advice or recommendations for any individual security. This memorandum is being made available for educational purposes only and should not be used for any other purpose.
The information contained herein does not constitute and should not be construed as representation or solicitation for the purchase or sale of any security or related financial instruments in any jurisdiction. To determine which investment(s) may be appropriate for you, consult your financial advisor prior to investing.
Investing involves risks including possible loss of principal. Past performance does not guarantee future results. Any investment or investment strategy outlined herein are not suitable for all investors, readers should conduct their own review and exercise judgment prior to investing. Wherever there is the potential for profit there is also the possibility of loss. No investment strategy or risk management technique can guarantee return or eliminate risk in all market environments.
International investing involves special risks such as currency fluctuation and political instability and may not be suitable for all investors.
This report expresses the opinions and views of the author as of the date indicated and are based on the author's interpretation of the concepts therein, and may be subject to change without notice. Neither Highcroft, Inc., Gerald Asplund, nor LPL Financial, has no duty or obligation to update the information contained herein.
To the extent you are receiving investment advice from a separately registered independent investment advisor or broker, please note that Highcroft, Inc., Gerald Asplund, and LPL Financial are not an affiliate of and makes no representation with respect to such entity.
Certain information contained herein concerning economic trends, Fundamentals, and/or Technical analysis, and performance is based on or derived from information provided by independent third-party sources. The economic forecasts set forth in this material may not develop as predicted.
Technical analysis is generally based on the study of price movement, volume, sentiment, and trading flows in an attempt to identify and project price trends. Technical analysis does not consider the fundamentals of the underlying corporate issuer.
The sources from which information has been obtained is assumed to be reliable; the accuracy of such information is not guaranteed and the accuracy and completeness of such information has not been independently verified.
From time to time the publisher, his associates or members of his family may have a position in the securities mentioned in this report: This report, including the information contained herein, has been prepared exclusively for the use of Highcroft, Inc. clients, and may not be copied, reproduced, redistributed, republished, or posted in whole or in part, in any form without the prior written consent of Highcroft, Inc.
All indexes are unmanaged and cannot be invested into directly. Unmanaged index returns do not reflect fees, expenses, or sales charges. Index performance is not indicative of the performance of any investment. All performance referenced is historical and is no guarantee of future results. Investing in the index would require investors purchase an investment product, which would involve fees and expenses.
ABOUT US
Highcroft Investment Advisors provides retirement planning, investment management, financial planning, fiduciary investment management, and lifetime income planning. Certified Financial Planner. Working with business owners, individuals, and wealthy families near Wayzata, Minnetonka, Plymouth, Orono, Minnetrista, and Minneapolis Minnesota (55402, 55391, 55447, 55364, 55428).
Highcroft Investment Advisors serves as a 3(21) and 3(38) Investment Advisor and fiduciary for labor union supplemental 401(k) and pension plans and corporate 401(k) plans. Highcroft works with the union's counsel, recordkeeper, administrator, and the plan's trustees. United Association, Plumbers, Pipefitters, Steamfitters, IBEW, and Carpenters. Serving Wisconsin and Minnesota. 401(k) investment management provided through LPL Financial's corporate RIA - offering 3(21) and 3(38) services.
Working with business owners, individuals, and wealthy families near Wayzata, Minnetonka, Plymouth, Orono, Minnetrista, and Minneapolis Minnesota (55402, 55391, 55447, 55364, 55428). As independent financial advisors we are not driven by certain products or services, instead we focus on your needs as an individual. Services include fiduciary fee only, retirement and divorce financial planning, life insurance, capital preservation, lifetime income planning, bonds, stocks, ETF, income, IRA, brokerage, rollover IRAs. Financial advisor near me, financial planner near me, independent planner near me.