SEE-SAW: THE TECH BUBBLE AND A PIVOT TO VALUE
Last week’s comments by Federal Reserve Chair Jerome Powell have triggered quite a series of events, where he indicated raising rates sooner than the market was anticipating.
WHY IS THE MARKET SO VOLATILE?
We have been here before. In 2000 the US Markets were trading at extreme valuations and the air came out of the tech bubble over two years, the S&P 500 fell about -50% and the NASDAQ fell about -80% - without a recession. It didn’t crash, it was a death march. But people were able to make money during that time-period.
Today is similar, the market is conflicted and asking what is the leadership. Stocks have been flat for months, rates are going up and the Fed/Government just got done with a massive amount of money printing (I know, the money printing in 2000 was nothing compared to today but it was a lot for the times). This is causing the volatility.
Volatility signals a leadership change.
PIVOT TO VALUE
Right now we have raised a bit of cash and are looking to pivot to commodities, banks, financials, industrials, small caps (value), and possibly real estate. These categories have historically done well in a rising interest rate environment. Allocations could transition fully from growth and technology and into inflation and sectors that benefit from rising rates over the coming months.
We will be owning both growth and value, so long as the growth can hold up. We could also be in a position where we are holding higher cash and bond levels.
WHAT DID THIS TRANSITION LOOK LIKE IN 2000?
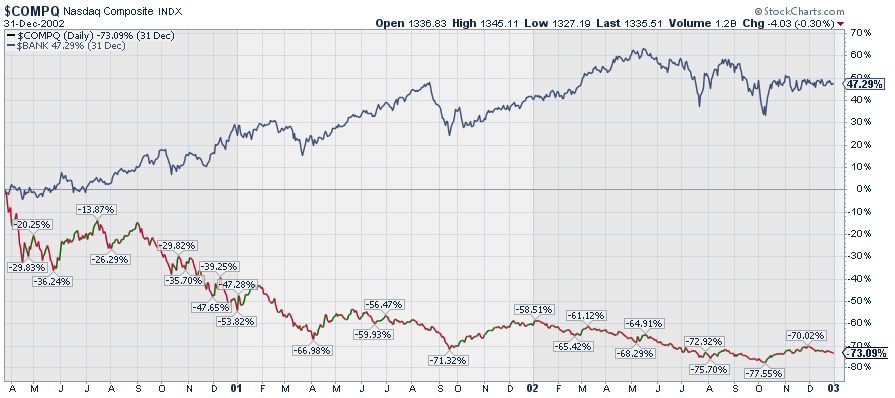
Here is a chart on the NASDAQ, from 2000 to 2003 the index fell from 5,132 to a low of 1,108. The S&P 500 was smoked too, this was due to the large cap technology and growth stocks that were repriced to lower levels.

A price drop of -73.09%.

If you bought the NASDAQ in 1999 it took 14 years to break even, that is the danger of being invested in a bubble.
Rising rates is good for banks, who are expected to make more money as a result. This chart compares the return over the 2000 – 2003 time period between the NASDAQ (technology and growth) to banks. The NASDAQ Bank Index was +47.92% versus the NASDAQ’s broader return of -73.09%!
Similar story for commodities. The S&P GSCI Commodity Index returned +18.28% versus the NASDAQ’s -73.09% return. This is the inflation theme.

So the broader point is that investors need to be cognizant of the excessive valuations in certain parts of the markets and how the interest rate policy of the Federal Reserve Bank will affect money flows. It is expected that money will flow from high valuation technology and growth to value categories that I previously outlined.
Note: past performance is not an indication of future results and expectations might not materialize. Current investor concerns could evaporate as fast as they occurred.
LPL 1-05239495
DEFINITIONS
NASDAQ Bank Index - The NASDAQ Bank Index contains securities of NASDAQ-listed companies classified according to the Industry Classification Benchmark as Banks. They include banks providing a broad range of financial services, including retail banking, loans and money transmissions.
NASDAQ Composite Index - is the market capitalization-weighted index of over 2,500 common equities listed on the Nasdaq stock exchange. The types of securities in the index include American depositary receipts, common stocks, real estate investment trusts (REITs) and tracking stocks, as well as limited partnership interests. The index includes all Nasdaq-listed stocks that are not derivatives, preferred shares, funds, exchange-traded funds (ETFs) or debenture securities.
S&P 500 Index - The modern design of the S&P 500 stock index was first launched in 1957. Performance back to 1950 incorporates the performance of predecessor index, the S&P 90. The index is a capitalization weighted index of the 500 large companies listed on various stock exchanges (such as the NYSE or NASDAQ). The S&P 500 was developed and continues to be maintained by S&P Dow Jones Indices, a joint venture majority-owned by S&P Global. The S&P 500 differs from the Dow Jones Industrial Average and the NASDAQ Composite index, because of its diverse constituency and weighting methodology. It is one of the most followed equity indices, and many consider it one of the best representations of the U.S. stock market.
S&P GSCI Commodity Index - The S&P GSCI serves as a benchmark for investment in the commodity markets and as a measure of commodity performance over time. It is a tradable index that is readily available to market participants of the Chicago Mercantile Exchange. The index was originally developed in 1991, by Goldman Sachs
Trailing Stop - The term stop loss refers to a general strategy whereby investors desire to limit declines in their investment holdings and avoid participating in a significant drawdown. The strategy does not eliminate the possibility of loss, it is designed rather to cut short the trend of continued losses. The strategy can lock in gains.
Trailing Stop Order - A trailing stop order is setting a stop condition, creating a moving (i.e. trailing) activation price. Trailing stop orders have unique risks which include but are not limited to:
· Trailing stop prices are not guaranteed execution prices. The price at which a stop order ultimately is executed may be very different from the stop price.
· Trailing stop orders may be triggered by a short-lived, dramatic price change. During volatile market conditions the price of a stock can move significantly in a short period of time and trigger an execution of a stop order.
· Trailing Sell stop orders my exacerbate declines during times of extreme volatility. Activation of sell stop orders may add downward price pressure on a security.
· Trailing stop orders face risk from mechanical malfunction, system disruptions, some types of corporate actions (e.g. cash dividends), and bad price ticks; among other factors.
· This service may be discontinued or limited at any time and without prior notice.
Wealth Shield – A rules-based discipline that has capital preservation as its’ primary objective. The program exits investments that have broken a bull trend, shifting those investments into cash which is then ready funds to be reinvested into those investments that have superior momentum characteristics.
The discipline can lock in gains or minimize losses, preventing further declines. Wealth Shield acts as a brake when investments and markets generate downward momentum. Please note that this service is only provided on the Strategic Asset Management (SAM) accounts that Gerald Asplund manages with discretion, it does not apply to any non-discretionary accounts such as brokerage, 401k, or insurance accounts.
IMPORTANT DISCLOSURES
This correspondence expresses the opinions and views of the author as of the date indicated and are based on the author's interpretation of the concepts therein and may be subject to change without notice. Neither Highcroft Investment Advisors, Gerald Asplund, nor LPL Financial, has no duty or obligation to update the information contained herein.
The information contained herein does not constitute and should not be construed as representation or solicitation for the purchase or sale of any security or related financial instruments in any jurisdiction. To determine which investment(s) may be appropriate for you, consult your financial advisor prior to investing.
The opinions voiced in this material are for general information only and are not intended to provide specific advice or recommendations for any individual security. This memorandum is being made available for educational purposes only and should not be used for any other purpose.
Some of the statements may be regarded as forward-looking statements. Forward-looking statements are, by their nature, subject to uncertainty. Forward-looking statements may include assumptions relating to future investment and economic scenarios. When used herein, the words “anticipate”, “believe”, “could”, “estimate”, “expect”, “going forward”, “intend”, “may”, “ought to”, “plan”, “project”, “seek”, “should”, “will”, “would” and similar expressions are intended to identify forward-looking statements. These forward-looking statements reflect an opinion relating to future events and are not a guarantee of future performance or developments. Reliance on any forward-looking statements involves known and unknown risks and uncertainties. Actual results and events may differ materially from information contained in the forward-looking statemen ts as a result of a number of factors. Accordingly, you should be prudent with your reliance on any forward-looking information or statements.
Investing involves risks including possible loss of principal. Past performance does not guarantee future results. Any investment or investment strategy outlined herein are not suitable for all investors, readers should conduct their own review and exercise judgment prior to investing. Wherever there is the potential for profit there is also the possibility of loss. No investment strategy or risk management technique can guarantee return or eliminate risk in all market environments. International investing involves special risks such as currency fluctuation and political instability and may not be suitable for all investors. The fast price swings in commodities and currencies can result in significant volatility within an investor's holdings.
To the extent you are receiving investment advice from a separately registered independent investment advisor or broker, please note that Highcroft Investment Advisors, Gerald Asplund, and LPL Financial are not an affiliate of and makes no representation with respect to such entity.
Certain information contained herein concerning economic trends, Fundamentals, and/or Technical analysis, and performance is based on or derived from information provided by independent third-party sources. The economic forecasts set forth in this material may not develop as predicted.
Technical analysis is generally based on the study of price movement, volume, sentiment, and trading flows in an attempt to identify and project price trends. Technical analysis does not consider the fundamentals of the underlying corporate issuer.
The sources from which information has been obtained is assumed to be reliable; the accuracy of such information is not guaranteed and the accuracy and completeness of such information has not been independently verified.
This report, including the information contained herein, has been prepared exclusively for the use of Highcroft Investment Advisors clients, and may not be copied, reproduced, redistributed, republished, or posted in whole or in part, in any form without the prior written consent of Highcroft Investment Advisors.
All indexes are unmanaged and cannot be invested into directly. Unmanaged index returns do not reflect fees, expenses, or sales charges. Index performance is not indicative of the performance of any investment. All performance referenced is historical and is no guarantee of future results. Investing in the index would require investors purchase an investment product, which would involve fees and expenses.
ABOUT US
Highcroft Investment Advisors provides retirement planning, investment management, financial planning, fiduciary investment management, and lifetime income planning. Certified Financial Planner. Working with business owners, individuals, and wealthy families near Wayzata, Minnetonka, Plymouth, Orono, Minnetrista, and Minneapolis Minnesota (55402, 55391, 55447, 55364, 55428).
Highcroft INvestment Advisors serves as a 3(21) and 3(38) Investment Advisor and fiduciary for labor union supplemental 401(k) and pension plans and corporate 401(k) plans. Highcroft works with the union's counsel, recordkeeper, administrator, and the plan's trustees. United Association, Plumbers, Pipefitters, Steamfitters, IBEW, and Carpenters. Serving Wisconsin and Minnesota. 401(k) investment management provided through LPL Financial's corporate RIA - offering 3(21) and 3(38) services.
Working with business owners, individuals, and wealthy families near Wayzata, Minnetonka, Plymouth, Orono, Minnetrista, and Minneapolis Minnesota (55402, 55391, 55447, 55364, 55428). As independent financial advisors we are not driven by certain products or services, instead we focus on your needs as an individual. Services include fiduciary fee only, retirement and divorce financial planning, life insurance, capital preservation, lifetime income planning, bonds, stocks, ETF, income, IRA, brokerage, rollover IRAs. Financial advisor near me, financial planner near me, independent planner near me.