SHILLER CAPE RATIO 2ND HIGHEST LEVEL IN HISTORY
Shiller CAPE - The Stock Market is at it’s 2nd Highest Valuation in History
The stock market’s valuation is slightly higher than it was in 1929, higher than it was in 2008, and is second only to the high valuation achieved in 1999; as measured by the Shiller Cyclically Adjusted Price Earnings ratio (known as the CAPE). Chart and details below.

Source: https://www.multpl.com/shiller-pe
So who cares? Warren Buffett cares, as a value investor who pays attention to managing risk by avoiding over paying for an investment. In fact, his mentor Ben Graham (the Father of Value Investing) was a disciple of the Dow Theory. In a 2017 interview with CNBC Warren Buffett credited three people with his success; his father, his wife, and his mentor Benjamin Graham.
https://www.cnbc.com/2017/09/29/warren-buffett-credits-his-success-to-these-3-people.html
The Dow Theory is core to value investing, still in use today by thousands of investors.
Warren Buffett is the Chairman of Berkshire Hathaway. He has an uncanny knack for having a lot of cash on hand when valuations are high and things start to happen. By the way, Berkshire Hathaway has a record amount of cash on hand.
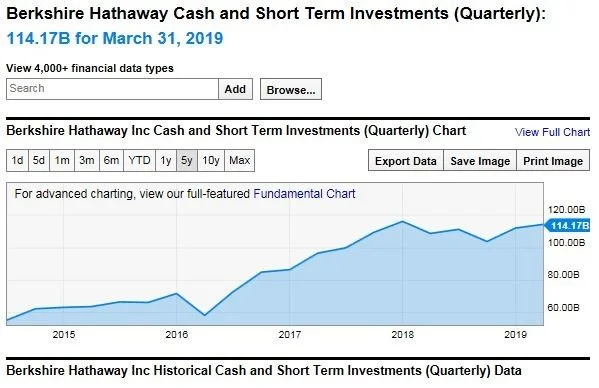
Source: www.ycharts.com
The CAPE was developed by Robert Shiller, a Nobel Prize winning economist at Yale. He popularized the metric during the Dotcom Bubble when he argued (correctly) that equities were highly overvalued. For that reason, it’s also casually referred to as the “Shiller PE”, meaning the Shiller variant of the typical price-to-earnings (PE) ratio of stocks.
http://www.econ.yale.edu/~shiller/
The level of the Shiller CAPE ratio is inversely related to future expected returns for the S&P 500. A low value indicates that stocks are priced at a low or reasonable valuation, when that happens Shiller calculates that the subsequent returns for the S&P 500 are above average. Likewise, when the Shiller CAPE has a high value the subsequent returns for the S&P 500 are low and can include large drawdowns.
Professor Shiller desired to improve upon the ‘regular PE Ratio’ by incorporating the effects of inflation, reducing fluctuations caused by the variation of profit margins throughout the business cycle, and the short term capabilities of CFOs to manipulate earnings. The result was a ratio that divides average earnings over the latest business cycle rather than just one recent year of bad or good earnings.
Why is the regular PE Ratio deceiving? The regular PE Ratio is calculated using the trailing 12 months of S&P 500 earnings. During economic expansions, companies have high profit margins and earnings. The PE Ratio then looks artificially low due to higher earnings. During recessions, profit margins are low and earnings are low. The ratio then looks artificially higher.
An example, the highest peak for the regular PE was 123 in the first quarter of 2009 (the S&P 500 had just crashed 50% from its’ high in 2007). The regular PE Ratio was high because earnings were depressed. People should have been buying, but the regular PE Ratio said the market was too highly valued. On the other hand, the Shiller CAPE was at 13.3, its lowest level in decades, correctly indicating a better time to buy stocks.
Today the Shiller CAPE ratio is signaling over valuation, at a historic level. In my opinion it makes sense that investors prepare their portfolios for scenarios similar to 1929 and 1999, to me this is rational given that today’s Shiller CAPE ratio valuation is equivalent to those two periods.
LPL 1-857737
IMPORTANT DISCLOSURES
The opinions voiced in this material are for general information only and are not intended to provide specific advice or recommendations for any individual security. This memorandum is being made available for educational purposes only and should not be used for any other purpose.
The information contained herein does not constitute and should not be construed as representation or solicitation for the purchase or sale of any security or related financial instruments in any jurisdiction. The investments discussed or recommended in this report may not be suitable for all investors. To determine which investment(s) may be appropriate for you, consult your financial advisor prior to investing.
Investing involves risks including possible loss of principal. Past performance does not guarantee future results. Any investment or investment strategy outlined herein are not suitable for all investors, readers should conduct their own review and exercise judgment prior to investing. Wherever there is the potential for profit there is also the possibility of loss. No investment strategy or risk management technique can guarantee return or eliminate risk in all market environments.
This report expresses the opinions and views of the author as of the date indicated and are based on the author's interpretation of the concepts therein, and may be subject to change without notice. Neither Highcroft, Inc., Gerald Asplund, nor LPL Financial, LLC has no duty or obligation to update the information contained herein.
To the extent you are receiving investment advice from a separately registered independent investment advisor or broker, please note that Highcroft, Inc., Gerald Asplund, and LPL Financial LLC are not an affiliate of and makes no representation with respect to such entity.
Certain information contained herein concerning economic trends, Fundamentals, and/or Technical analysis, and performance is based on or derived from information provided by independent third-party sources.
The economic forecasts set forth in this material may not develop as predicted.
Technical analysis is generally based on the study of price movement, volume, sentiment, and trading flows in an attempt to identify and project price trends. Technical analysis does not consider the fundamentals of the underlying corporate issuer.
The sources from which information has been obtained is assumed to be reliable; the accuracy of such information is not guaranteed and the accuracy and completeness of such information has not been independently verified.
From time to time the publisher, his associates or members of his family may have a position in the securities mentioned in this report: This report, including the information contained herein, has been prepared exclusively for the use of Highcroft, Inc. clients, and may not be copied, reproduced, redistributed, republished, or posted in whole or in part, in any form without the prior written consent of Highcroft, Inc.
The modern design of the S&P 500 stock index was first launched in 1957. Performance back to 1950 incorporates the performance of predecessor index, the S&P 90.
All indexes are unmanaged and cannot be invested into directly. Unmanaged index returns do not reflect fees, expenses, or sales charges. Index performance is not indicative of the performance of any investment. All performance referenced is historical and is no guarantee of future results.
The investment products sold through LPL Financial are not insured deposits and are not FDIC/NCUA insured. These products are not Bank/Credit Union obligations and are not endorsed, recommended or guaranteed by any Bank/Credit Union or any government agency. The value of the investment may fluctuate, the return on the investment is not guaranteed, and loss of principal is possible.
ABOUT US
Highcroft Investment Advisors provides retirement planning, investment management, financial planning, fiduciary investment management, and lifetime income planning. Certified Financial Planner. Working with business owners, individuals, and wealthy families near Wayzata, Minnetonka, Plymouth, Orono, Minnetrista, and Minneapolis Minnesota (55402, 55391, 55447, 55364, 55428).
Highcroft Investment Advisors serves as a 3(21) and 3(38) Investment Advisor and fiduciary for labor union supplemental 401(k) and pension plans and corporate 401(k) plans. Highcroft works with the union's counsel, recordkeeper, administrator, and the plan's trustees. United Association, Plumbers, Pipefitters, Steamfitters, IBEW, and Carpenters. Serving Wisconsin and Minnesota. 401(k) investment management provided through LPL Financial's corporate RIA - offering 3(21) and 3(38) services.
Working with business owners, individuals, and wealthy families near Wayzata, Minnetonka, Plymouth, Orono, Minnetrista, and Minneapolis Minnesota (55402, 55391, 55447, 55364, 55428). As independent financial advisors we are not driven by certain products or services, instead we focus on your needs as an individual. Services include fiduciary fee only, retirement and divorce financial planning, life insurance, capital preservation, lifetime income planning, bonds, stocks, ETF, income, IRA, brokerage, rollover IRAs. Financial advisor near me, financial planner near me, independent planner near me.