VALUATION UPDATE Q3 2020
With earnings estimates continuing to fall for 2020 it does not look like valuations will get better any time soon.
The following chart from FactSet illustrates the divergence between stock prices and earnings. Stock prices generally follow earnings. The deviation is not a positive since earnings are not likely to rapidly catch up to price any time soon [not to mention that the overall return is largely embedded in a concentrated list of highly valued companies]. It is possible that price will revert to the earnings trend first.

Forward Price/Earnings Ratio valuations the highest in the past 10 years, courtesy FactSet.

Valuations are packed into high priced stocks, as indicated by the chart below where the ratio of the value of the NASDAQ 100 has approached the over-valuation of 2000 where the value of the NASDAQ 100 has become 3 times that of the S&P 500. Sustainable?
Chart courtesy of Lohman Econometrics.

This concentration can be seen in the 70 year relative data chart below (courtesy Bank of America) where the valuation of US equities, versus Developed Market equities ex-US, is now 2.3 times and well outside of the one standard deviation metric that we were taught was standard in scientific circles, back in high school (meaning that ventures into the lower probably category doesn’t last long).

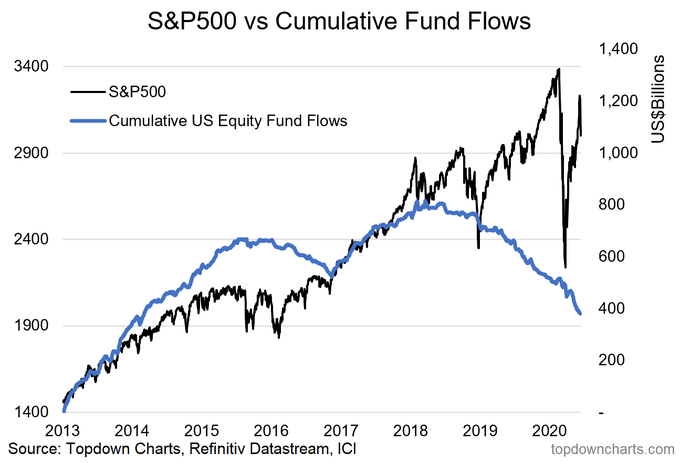
All of this explains the following chart from Refinitiv where we can see investors moving monies out of stocks. The financial industry tracks sales to the penny, posting information weekly and monthly. This explains how the overall market can be propped up by a few super-cap stocks with high valuations, masking what is going under the surface broadly.
It’s data to be aware of and information to factor into the risk reward.
LPL 1-05032834
DEFINITIONS
NASDAQ 100 Index: The NASDAQ-100 is a stock market index made up of 103 equity securities issued by 100 of the largest non-financial companies listed on the Nasdaq stock market. It is a modified capitalization-weighted index. The stocks' weights in the index are based on their market capitalizations, with certain rules capping the influence of the largest components. It is based on exchange, and it does not have any financial companies. The financial companies were put in a separate index, the NASDAQ Financial-100.
S&P 500: The modern design of the S&P 500 stock index was first launched in 1957. Performance back to 1950 incorporates the performance of predecessor index, the S&P 90.
The index is a capitalization weighted index of the 500 large companies listed on various stock exchanges (such as the NYSE or NASDAQ). The S&P 500 was developed and continues to be maintained by S&P Dow Jones Indices, a joint venture majority-owned by S&P Global. The S&P 500 differs from the Dow Jones Industrial Average and the NASDAQ Composite index, because of its diverse constituency and weighting methodology. It is one of the most commonly followed equity indices, and many consider it one of the best representations of the U.S. stock market.
IMPORTANT DISCLOSURES
The opinions voiced in this material are for general information only and are not intended to provide specific advice or recommendations for any individual security. This memorandum is being made available for educational purposes only and should not be used for any other purpose.
The information contained herein does not constitute and should not be construed as representation or solicitation for the purchase or sale of any security or related financial instruments in any jurisdiction. To determine which investment(s) may be appropriate for you, consult your financial advisor prior to investing.
Investing involves risks including possible loss of principal. Past performance does not guarantee future results. Any investment or investment strategy outlined herein are not suitable for all investors, readers should conduct their own review and exercise judgment prior to investing. Wherever there is the potential for profit there is also the possibility of loss. No investment strategy or risk management technique can guarantee return or eliminate risk in all market environments.
International investing involves special risks such as currency fluctuation and political instability and may not be suitable for all investors.
This report expresses the opinions and views of the author as of the date indicated and are based on the author's interpretation of the concepts therein, and may be subject to change without notice. Neither Highcroft, Inc., Gerald Asplund, nor LPL Financial, has no duty or obligation to update the information contained herein.
To the extent you are receiving investment advice from a separately registered independent investment advisor or broker, please note that Highcroft, Inc., Gerald Asplund, and LPL Financial are not an affiliate of and makes no representation with respect to such entity.
Certain information contained herein concerning economic trends, Fundamentals, and/or Technical analysis, and performance is based on or derived from information provided by independent third-party sources. The economic forecasts set forth in this material may not develop as predicted.
Technical analysis is generally based on the study of price movement, volume, sentiment, and trading flows in an attempt to identify and project price trends. Technical analysis does not consider the fundamentals of the underlying corporate issuer.
The sources from which information has been obtained is assumed to be reliable; the accuracy of such information is not guaranteed and the accuracy and completeness of such information has not been independently verified.
All indexes are unmanaged and cannot be invested into directly. Unmanaged index returns do not reflect fees, expenses, or sales charges. Index performance is not indicative of the performance of any investment. All performance referenced is historical and is no guarantee of future results. Investing in the index would require investors purchase an investment product, which would involve fees and expenses.
ABOUT US
Highcroft Investment Advisors provides retirement planning, investment management, financial planning, fiduciary investment management, and lifetime income planning. Certified Financial Planner. Working with business owners, individuals, and wealthy families near Wayzata, Minnetonka, Plymouth, Orono, Minnetrista, and Minneapolis Minnesota (55402, 55391, 55447, 55364, 55428).
Highcroft Investment Advisors serves as a 3(21) and 3(38) Investment Advisor and fiduciary for labor union supplemental 401(k) and pension plans and corporate 401(k) plans. Highcroft works with the union's counsel, recordkeeper, administrator, and the plan's trustees. United Association, Plumbers, Pipefitters, Steamfitters, IBEW, and Carpenters. Serving Wisconsin and Minnesota. 401(k) investment management provided through LPL Financial's corporate RIA - offering 3(21) and 3(38) services.
Working with business owners, individuals, and wealthy families near Wayzata, Minnetonka, Plymouth, Orono, Minnetrista, and Minneapolis Minnesota (55402, 55391, 55447, 55364, 55428). As independent financial advisors we are not driven by certain products or services, instead we focus on your needs as an individual. Services include fiduciary fee only, retirement and divorce financial planning, life insurance, capital preservation, lifetime income planning, bonds, stocks, ETF, income, IRA, brokerage, rollover IRAs. Financial advisor near me, financial planner near me, independent planner near me.