VALUATION UPDATE 2020 Q2
Our grandparents would make a point with a question: “what are you going to do with that car once you catch it?”, alluding to the craziness of dogs chasing cars and biting tires.

Well, Wall Street provides many examples of this behavior where investors emotionally chase concept stocks. At the end of the cycle Wall Street crowds into ‘the stocks that you have to own’ and those ideas tend to get more and more over bought. This has happened during many, not all, expansions since the Nifty Fifty dominated the 1960’s bull market (the idea was that you only needed to buy 50 stocks and you would be fine, yes, it ended badly).
Looking at the graph that I shared with you earlier this week you can see that currently 5 mega cap stocks dominate the stock market and market returns as they did at the end of the technology bubble in 2000.

Let’s look at the ‘5 Amigos’ as I have dubbed them, more closely. What exactly, from a valuation perspective, would you be putting your money into if you chased the FOMO rally (Fear Of Missing Out)? In my opinion, 5 good companies that have over-valued stock prices.
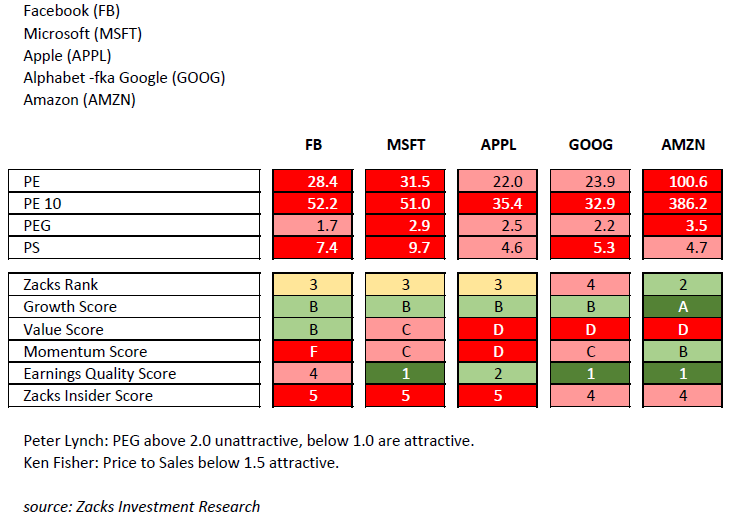
The first four lines represent basic price to earnings and price to sales data. Light and dark red represent the highest valuations (top 20% in terms of expense and then the next quintile, the top 21% to 40%). Given that the ten year average for a PE Ratio (price to earnings ratio) on the S&P 500 is 14 and currently the S&P 500 has a TTM PE Ratio of 20, the PE ratios are high: from 22 to 100.6.
The PE 10 figure is the Price to Earnings Ratio average over the past 10 years: from 32 to 386.
At the bottom of the above table there is a note relating to two legends of the investment business Peter Lynch and Ken Fisher. They created rules, which not only made them famous but infamous in investment circles, which guided them to success; much like Warren Buffet. These investors were known for sticking to their guns.
Peter Lynch said that a Price to Earnings Growth rate (the PEG Ratio) below 1.0 was attractive (a buy), above 2.0 was unattractive (a sell), and between the numbers was a ‘probably not’. None of the 5 Amigos would be on Peter Lynch’s buy list, a person who is one of the most well known and successful top growth managers.
The Price to Sales Ratio is handy because it allows an investor to better compare companies across industries and between countries. Ken Fisher found that if he could find companies with a PS Ratio below 1.5 he might have a winner, the 5 Amigos are trading a many multiples of his line in the sand.
If Peter Lynch and Ken Fisher would not put their money into these 5 companies should you, or should you not, put your retirement money into said companies? (in spite of the high quality cat videos on Facebook.
The 5 lines at the bottom are the Zack’s Investment Research rankings (A to F) and scores (1 being best). Good growth scores, lousy value scores. Good earnings quality scores (other an Facebook) but poor insider scores (the insiders are net sellers). Overall ranking typically 3 or below, but mostly in the middle; in my opinion it’s hard to justify the high valuations.
Let’s pull out one company, Apple, and dig into their earnings. Earnings are the lifeblood of the stock market. The table below summarizes Apple’s net income and earnings per share over the past 5 years.
Total net income growth +3.4%, or +0.69% per year. Net income in 2015 $53B and $55B in 2019; it went down, up, and down again; basically ending up where it was in 2015.
Total EPS growth +28.95% or 5.79% per year.
I know, I know: you’re saying to yourself “why would I want to pay a high PE multiple, high PEG ratio, and high Price to Sales rate for low to below average growth?”

Here is the Apple data from Zacks Investment Research. (the per share data from above looks better than the net income data due to share buy backs, you can see that the shares outstanding on the table below goes down over time)

In my opinion it is high likely that investors will look back at this scenario and scratch their heads like they did in the early 2000s after the tech bubble burst.
I wish you the best.
LPL 1-05005039
DEFINITIONS
Price-to-Earnings Ratio: The price-to-earnings ratio (P/E ratio) is the ratio for valuing a company that measures its current share price relative to its per-share earnings (EPS). The price-to-earnings ratio is also sometimes known as the price multiple or the earnings multiple.
Price-to-Sales Ratio: The price-to-sales (P/S) ratio is a valuation ratio that compares a company’s stock price to its revenues. It is an indicator of the value placed on each dollar of a company’s sales or revenues. The ratio can be calculated by dividing the company’s market capitalization by its total sales or on a per-share basis by dividing the stock price by sales per share.
S&P 500 Index: The modern design of the S&P 500 stock index was first launched in 1957. Performance back to 1950 incorporates the performance of predecessor index, the S&P 90. The index is a capitalization weighted index of the 500 large companies listed on various stock exchanges (such as the NYSE or NASDAQ). The S&P 500 was developed and continues to be maintained by S&P Dow Jones Indices, a joint venture majority-owned by S&P Global. The S&P 500 differs from the Dow Jones Industrial Average and the NASDAQ Composite index, because of its diverse constituency and weighting methodology. It is one of the most commonly followed equity indices, and many consider it one of the best representations of the U.S. stock market.
IMPORTANT DISCLOSURES
This report expresses the opinions and views of the author as of the date indicated and are based on the author's interpretation of the concepts therein, and may be subject to change without notice. Neither Highcroft, Inc., Gerald Asplund, nor LPL Financial, has no duty or obligation to update the information contained herein. The opinions voiced in this material are for general information only and are not intended to provide specific advice or recommendations for any individual security. This memorandum is being made available for educational purposes only and should not be used for any other purpose.
The information contained herein does not constitute and should not be construed as representation or solicitation for the purchase or sale of any security or related financial instruments in any jurisdiction. To determine which investment(s) may be appropriate for you, consult your financial advisor prior to investing.
Some of the statements may be regarded as forward-looking statements. Forward-looking statements are, by their nature, subject to uncertainty. Forward-looking statements may include assumptions relating to future investment and economic scenarios. When used herein, the words “anticipate”, “believe”, “could”, “estimate”, “expect”, “going forward”, “intend”, “may”, “ought to”, “plan”, “project”, “seek”, “should”, “will”, “would” and similar expressions are intended to identify forward-looking statements. These forward-looking statements reflect an opinion relating to future events and are not a guarantee of future performance or developments. Reliance on any forward-looking statements involves known and unknown risks and uncertainties. Actual results and events may differ materially from information contained in the forward-looking statements as a result of a number of factors. Accordingly, you should be prudent with your reliance on any forward-looking information or statements.
Investing involves risks including possible loss of principal. Past performance does not guarantee future results. Any investment or investment strategy outlined herein are not suitable for all investors, readers should conduct their own review and exercise judgment prior to investing. Wherever there is the potential for profit there is also the possibility of loss. No investment strategy or risk management technique can guarantee return or eliminate risk in all market environments.
International investing involves special risks such as currency fluctuation and political instability and may not be suitable for all investors.
To the extent you are receiving investment advice from a separately registered independent investment advisor or broker, please note that Highcroft, Inc., Gerald Asplund, and LPL Financial are not an affiliate of and makes no representation with respect to such entity.
Certain information contained herein concerning economic trends, Fundamentals, and/or Technical analysis, and performance is based on or derived from information provided by independent third-party sources. The economic forecasts set forth in this material may not develop as predicted.
Technical analysis is generally based on the study of price movement, volume, sentiment, and trading flows in an attempt to identify and project price trends. Technical analysis does not consider the fundamentals of the underlying corporate issuer.
The sources from which information has been obtained is assumed to be reliable; the accuracy of such information is not guaranteed and the accuracy and completeness of such information has not been independently verified.
From time to time the publisher, his associates or members of his family may have a position in the securities mentioned in this report: This report, including the information contained herein, has been prepared exclusively for the use of Highcroft, Inc. clients, and may not be copied, reproduced, redistributed, republished, or posted in whole or in part, in any form without the prior written consent of Highcroft, Inc.
All indexes are unmanaged and cannot be invested into directly. Unmanaged index returns do not reflect fees, expenses, or sales charges. Index performance is not indicative of the performance of any investment. All performance referenced is historical and is no guarantee of future results. Investing in the index would require investors purchase an investment product, which would involve fees and expenses.
The fast price swings in commodities and currencies can result in significant volatility within an investor’s holdings.
ABOUT US
Highcroft InVestment Advisors provides retirement planning, investment management, financial planning, fiduciary investment management, and lifetime income planning. Certified Financial Planner. Working with business owners, individuals, and wealthy families near Wayzata, Minnetonka, Plymouth, Orono, Minnetrista, and Minneapolis Minnesota (55402, 55391, 55447, 55364, 55428).
Highcroft Investment Advisors serves as a 3(21) and 3(38) Investment Advisor and fiduciary for labor union supplemental 401(k) and pension plans and corporate 401(k) plans. Highcroft works with the union's counsel, recordkeeper, administrator, and the plan's trustees. United Association, Plumbers, Pipefitters, Steamfitters, IBEW, and Carpenters. Serving Wisconsin and Minnesota. 401(k) investment management provided through LPL Financial's corporate RIA - offering 3(21) and 3(38) services.
Working with business owners, individuals, and wealthy families near Wayzata, Minnetonka, Plymouth, Orono, Minnetrista, and Minneapolis Minnesota (55402, 55391, 55447, 55364, 55428). As independent financial advisors we are not driven by certain products or services, instead we focus on your needs as an individual. Services include fiduciary fee only, retirement and divorce financial planning, life insurance, capital preservation, lifetime income planning, bonds, stocks, ETF, income, IRA, brokerage, rollover IRAs. Financial advisor near me, financial planner near me, independent planner near me.